We’ve had a question that has been asked through our Blog form and the question is:
“How we can calculate average for a large data (e.g.24 hours data records of per second each) after downloading multiple files from the meter.
Simple averaging can be produced will not represent the level of energy of a record. For example, 45, 46, 48, 43, 78, 79, 71, 33, 55 levels, the simple arithmetic average would be 55.3.
But the energy level of noise for 78, 79 and 71 is high compared to other values so how can we calculate the average now?“.
This is an interesting question regarding noise data averaging and one that we get asked quite frequently.
There are some applications where you would use a simple linear average to calculate a value from noise measurements but these are few and often very specific.
In this case, what you need to do is to do a logarithmic average of the values. This can be done quite easily if you are using a spreadsheet.
In this case, we’ll assume that we have a set of samples, each of which is a 1 second Leq value and the total period is 24 hours. This gives us a total of 86400 samples and we will use this number later in the calculation.
What we are looking to achieve is a 24 hours Leq using the noise data that we’ve downloaded from our sound level meter.
To learn more about acoustic terms that will help you to use and understand your noise measuring equipment better, check out our FREE guide to noise terminology.
Here’s a 6 Step Guide for Calculating the “Average” Noise Level
The simplest way to do this would be to put the numbers into an Excel document with the values in a single column. We would have 84,600 values for a complete 24 hour period. If you are running the latest version of Excel, 2010, then you can use this many cells and calculate the information in a single pass.
If you are using Excel 2003 or earlier, then you will be limited to using 65,536 rows and you will have to break up the data into 12 hour blocks and then do a second calculation using the two sections of data.
The steps below assume that you can work with the 86400 samples in a single pass.
Step 1.
Put the individual 1 second samples into column A starting at row 5. We will need some space to put the final calculations later. This will give us values in the cells from A5 to A86405

Step 2.
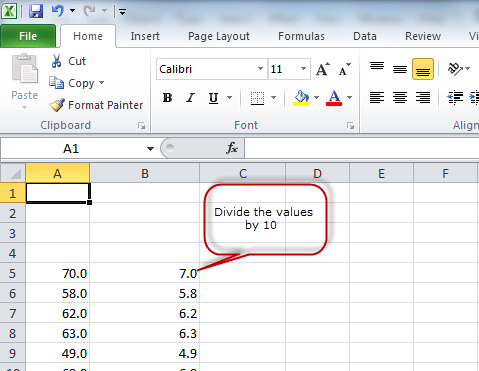
In the second column, divide each value by 10. In cell B5 enter =A5/10
Copy this into all of the cells from B6 down to B86405
Step 3.
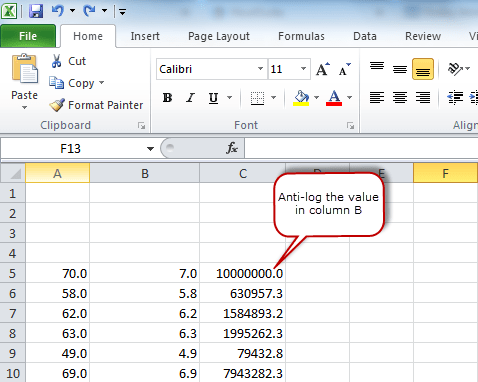
Now anti-log the value from Step 2. In cell C5 enter =10^B5
Copy this into all of the cells from C6 down to C86405
Step 4.
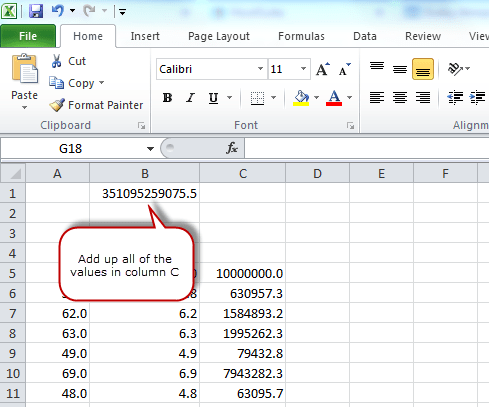
Add together all of the values in column C. In cell B1 enter =SUM(C5:C86405)
This will give the total noise energy over the total 24 hour period.
Step 5.
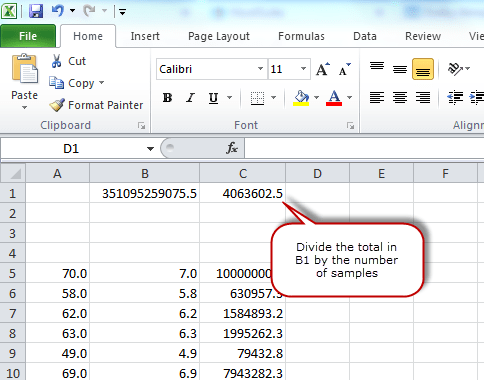
We now need to divide this total by the number of samples.
In cell C1 enter =B1/86400
Step 6.
We now need to base 10 log this number and multiply it by 10.
In cell D1 enter =10*log(C1)
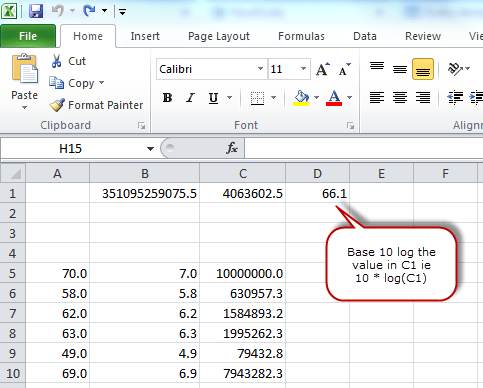
This gives us the average noise energy over the entire 24 hour period.


