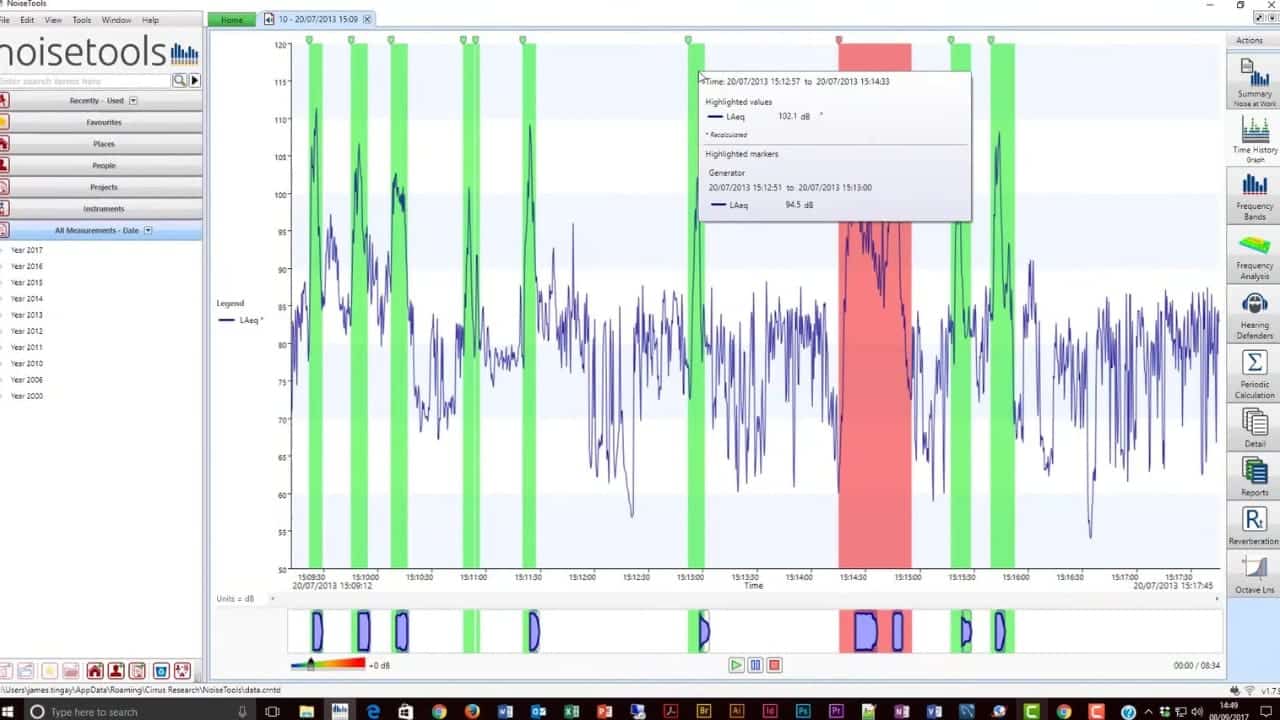
The Markers tool within the NoiseTools software is a powerful feature that allows sections of a measurement to be coded, analysed or removed from calculations. This video introduces the concept of markers and shows how to use the basic functions of the marker system.
Note that this video was made using NoiseTools 1.7.2. The latest version of NoiseTools can be downloaded from our website.

For more information or to view other tutorials, please visit our YouTube channel.
Video Transcription
In this tutorial we’re going to look at an introduction to the marker functions available in Noise Tools. We’ll start with an example measurement, eight and a half minutes long.
You can see the overall basic values, LEQ, LC peak and so on, and the graph showing us the noise level versus time. The blue line shows us the one second LEQ samples, and the green line shows us the one second peak samples.
[00:00:30]
The marker’s function is accessed through the time history tab on the right hand side. If you hover, you’ll see two options, graph and markers. If you select the button for time history, we get the graph, and by default this will show us the one second LEQ samples.
The options available to us here are to select different data channels, so can have all the information available to us. And we also have available to us the ability to switch on and off certain view settings.
In this example [00:01:00] what we need to be able to show is user markers. So we’ll disable the other two, if they’re switched on, and click …
In this example we’re going to look at how we can use markers to remove particular noise sources from the overall measurement and then to recalculate our total LAEQ. If you remember, our overall LAEQ for this measurement is 93.4dB, quite high.
So we’ll go back to our time history graph. Now there are particular spikes and peaks on this graph, and we’ve determined that some of these are from a generator [00:01:30] and some of them are from a pump.
If we can remove those, we want to be able to see what that effect has on our overall LAEQ. So to start with what we’ll do is we’ll drag over these three spikes at the beginning, right click, and we’ll zoom in. It just gives us a better idea of what we’re looking at.
Now what we’re going to do is drag over the first spike, right click with our mouse, and select “Mark”. This brings up the “Add Marker” button, and we’re going to call this one, “Generator”.
[00:02:00] And we’re going to choose green as its overall colour, and we can put some notes in here. So this is a generator starting and stopping. And if we click “Okay” that particular noise is marked as being a generator. And we’ll do the same again, so we’ll mark again. In this case, we’ll select the existing marker, the generator, and click, “OK.”
And we’ll do that for the third noise source here. Again right click, “Mark” [00:02:30] and select “Generator”. Click “Okay”. Now we use our mouse wheel just to zoom out a little bit further. And again we can select some particular noise sources, we’ll zoom in and we’ll determine that this one here is a generator starting and stopping.
So generator again. Smaller one next to it, that’s a generator as well, mark that. Select generator. And we’ll carry on doing this for the noise sources in the measurement, working our way through. [00:03:00] The aim is to be able to mark up particular noise sources.
Now, we determined that this one in the middle, it’s a particularly loud one, isn’t a generator. This is a pump starting and stopping. So we’ll mark it, and rather than selecting “Generator” we’ll create a new marker type. So we’ll give it a name of “Pump”. We’ll select red for it’s colour, and we click “Okay”. And there we can see the pump is selected in red.
So we’ll go back through our noise [00:03:30] sources and we’ll identify the other pumps. So highlight that one, zoom in, mark and select, “Generator”. And we’ll carry on doing that until we’ve got a number of generator noise sources marked up.
You can either zoom in or out using your mouse wheel, or you can use the slider bar at the bottom to move across the measurement data. So again, generator. There’s no limit to the number of markers that you can have. Markers can overlap each other. And you can have notes appended to each one.
So as [00:04:00] you hover your mouse over, you’ll see that it’s “Generator” and the notes will appear.
So there we can see, we’ve highlighted a number of generators and we’ve highlighted the pump. If you hover your mouse over one, so we’ll hover over pump, the grey pop out box shows us that the noise level for that particular noise source and at that particular point.
We’re now going to look at looking the marker’s table. So hover and select “Markers” and the table will appear. Now what we see here is a list of all the generator noise sources and the pump noise source that we’ve already selected.
[00:04:30] Start time, end time, the label, and the individual LAEQ for each noise source that we’ve identified. Listed in time order. At the bottom of the screen, there is a “Combine Markers” button. So if you click that it now shows that there are nine instances of the generator and the overall LAEQ.
And at the bottom of the screen we now have a remainder. This is the noise that’s left once all those noise sources have been removed. If we untick some of the markers, [00:05:00] it stays the same.
So we know that by eliminating all those noise sources, our overall LAEQ would go down to 82.9dB. So by removing all those markers, all those marked sections from the noise, this gives you the information to say, “Well, we’d be able to reduce from 93.4dB, if we took all those noise sources out, what would be left?” And the answer is 82.9dB.
Now that we’ve marked up our information, we can right click, and from the pop up that appears [00:05:30] on the screen, we can select, “Export”, “Generate Report”. And the software will create for us a time history measurement report, including all the marked sections.
So we see on the report the overall measurement data, instrument type, calibration information and so on, but also the total LAEQ without the markers. The markers are shown in colour on the graph.
And if you go to page two, we see the tabular format of the data. So here are all the individual markers, the LAEQ for each marker, the total [00:06:00] energy and LAEQ, one minute 13 seconds for the generator, the information for the pump. So we have one instance of the pump, 40 seconds and that was 99.8dB.
And down at the bottom what was left, so 82.9dB was left, having removed all those individual noise sources from the calculation.
This can be particularly useful if you’re determining whether to provide hearing protection or not. If you’ve got a measurement with one or two particularly noisy sections that influence in the overall [00:06:30] measurement, you can mark those and work out what the noise exposure would be if those noise sources were removed.
It would then allow you to determine whether you can use noise control measures, whether you’ve got to provide hearing protection, or by changing work need patterns you can reduce someone’s noise exposure.
So thank you very much. That’s the end of this tutorial. If you have any problems, any questions, or you’d like any more advice, please call us or email us at support.desk@cirrusresearch.com.
Thank you.


