When more detailed information about a complex sound is needed, the frequency range of 20Hz to 20kHz can be split into sections or bands. This is done electronically within a sound level meter.
These bands usually have a bandwidth of one octave or one third octave. More advanced instruments may be able to give a narrow band analysis of the noise data. This may be an FFT (Fast Fourier Transform) or information in 1/12 octaves.
An octave band is a frequency band where the highest frequency is twice the lowest frequency.
For example, an octave filter with a centre frequency of 1kHz has a lower frequency of 707Hz and an upper frequency of 1.414kHz. Any frequencies below and above these limits are rejected. A third octave has a width of 1/3 of that of an octave band.
To learn more about octave bands and other acoustic terms that will help you to use and understand your noise measuring equipment better, check out our FREE guide to noise terminology.
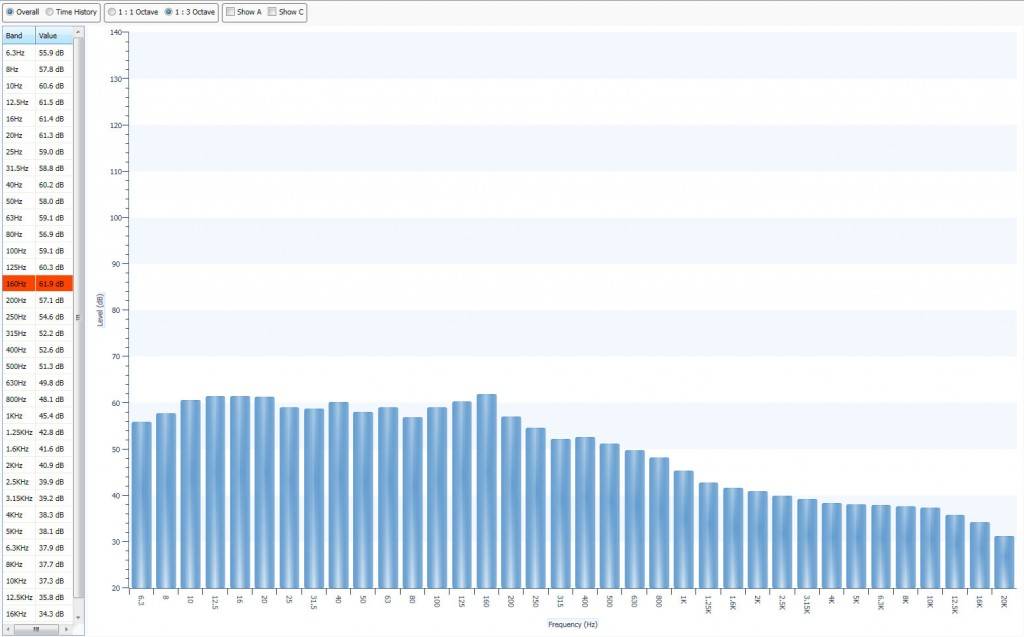
The figures below show a noise level split into both octave and third octaves:
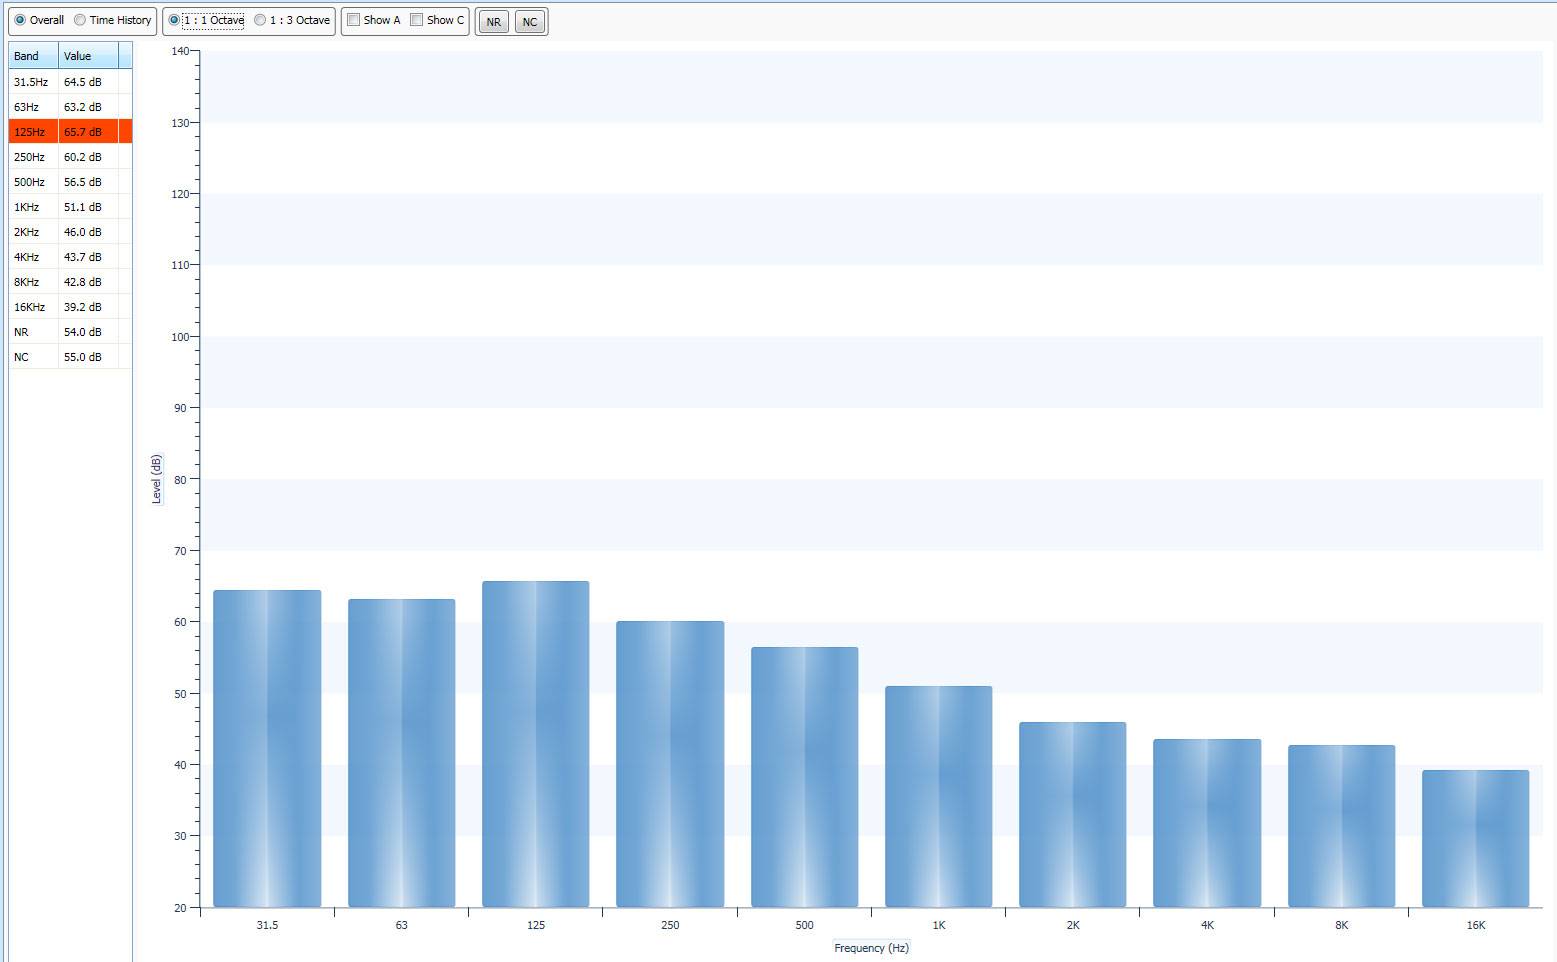
An example of Octave Band Analysis
One example of where frequency analysis is very useful is in the comparison of the noise generated by a turbine and a compressor.
When the noise is measured using a sound level meter, the overall noise level is 113dB(A).
By using 1:1 octave band filters, we can break the noise from each machine into its component parts and it is very clear that the turbine is producing much more low frequency noise than the compressor.
This has implication when hearing protection is being specified. Different hearing protection will be needed for each machine as the PPE chosen for the compressor may not be suitable for the turbine.
This also applies when considering noise reduction enclosure or sound reduction materials.
The table below shows the noise levels for both the compressor (A) and the turbine (B). The first column shows the dB(A) values followed by the octave band figures. These octave band figures are those shown in the graph above.
| dB(A) | 31Hz | 63Hz | 125Hz | 250Hz | 500Hz | 1kHz | 2kHz | 4kHz | 8kHz | 16kHz | ||
|---|---|---|---|---|---|---|---|---|---|---|---|---|
| A | Compressor | 113.6 | 80 | 87 | 90 | 93 | 99 | 100 | 111 | 106 | 98 | 89 |
| B | Turbine | 113.6 | 113 | 122 | 116 | 116 | 115 | 97 | 85 | 60 | 57 | 42 |
| C | Enclosure | N/A | N/A | N/A | 6 | 13 | 25 | 26 | 28 | 29 | 33 | 33 |
| A-C | 85.7 | 84 | 80 | 74 | 74 | 83 | 77 | 66 | 56 | |||
| B-C | 99.8 | 110 | 103 | 90 | 71 | 57 | 31 | 24 | 9 |
The attenuation provided by a “standard” noise reducing enclosure is shown in row (C). The final two rows show the noise levels for the compressor and turbine after the attenuation provided by the enclosure has been added.
The overall dB(A) noise level produced by the turbine is reduced by 13dB(A), whilst the compressor noise is reduced by 27dB(A).
The additional information provided by the frequency analysis gives an understanding of why the compressor noise is reduced by 14dB(A) more than the turbine noise.
A simple dB(A) measurement may not have shown this.
The optimus sound level meters can provide both 1:1 and 1:3 octave band analysis of noise levels. If you would like further information, please call us on +44 1723 891655 and we will be pleased to help.
Download the Noise Measurement Terminology Guide to expand your noise knowledge and make measuring noise simpler.